Separate waiting from working
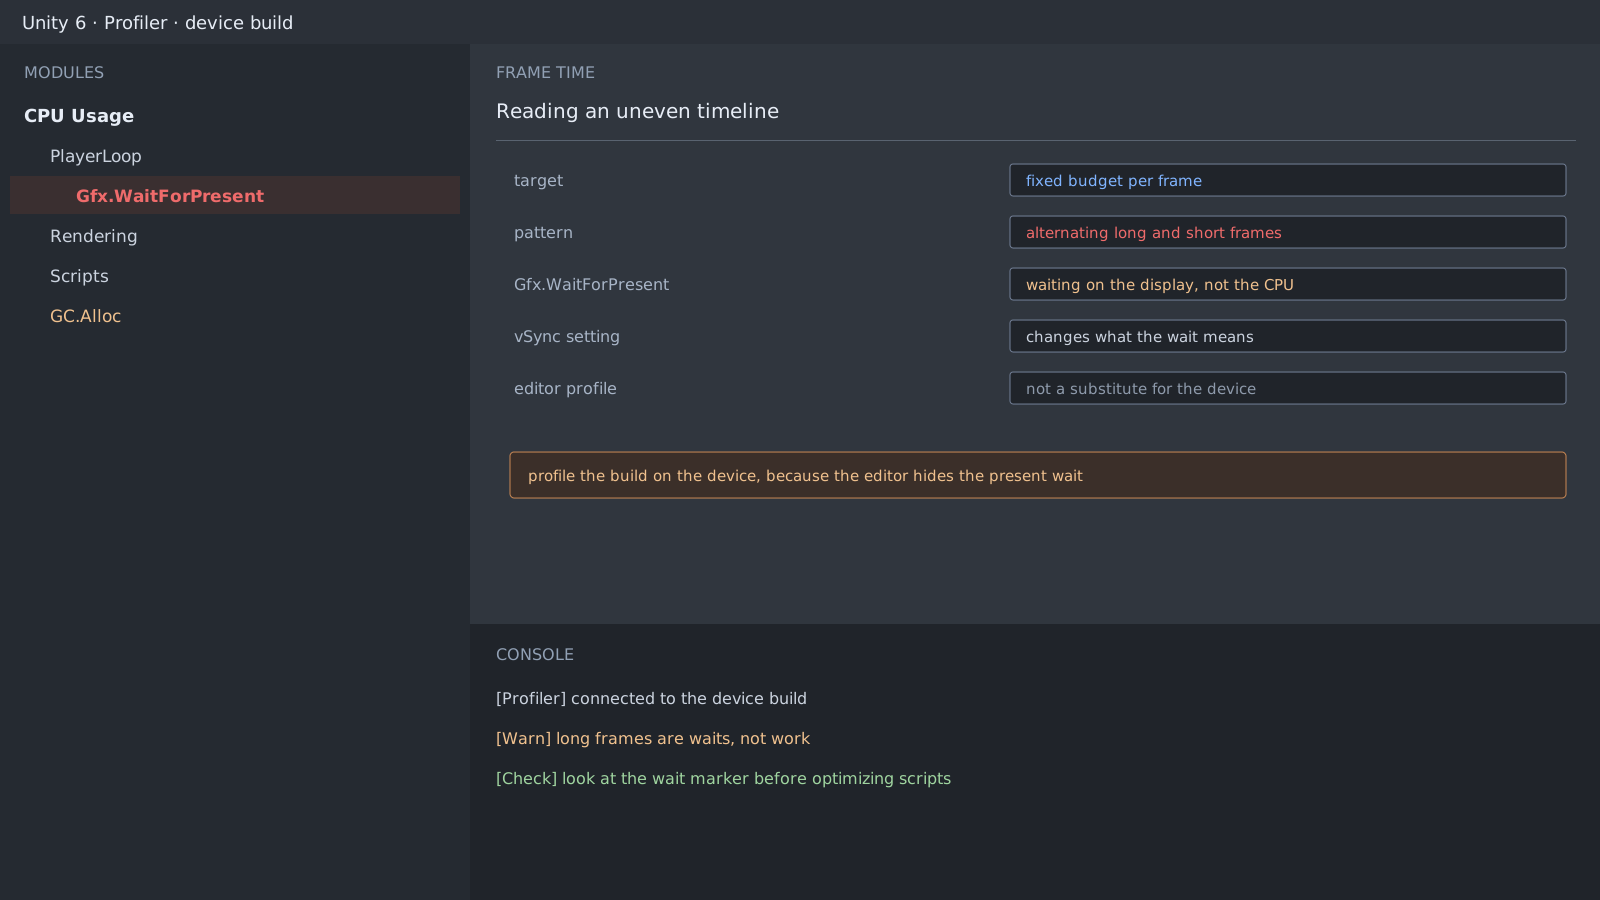
The habit is to find the longest bar in the Profiler and go fix that function. On a mobile build the longest bar is often not computation at all but time spent waiting to present a frame. Mistake it for work and you spend days rewriting healthy code.
Two things to read in the timeline: whether long frames alternate on a regular pattern, and whether the largest block inside one is a wait marker.
Editor profiling cannot show this
The Editor renders into a window, so its display synchronization differs from the device. Frame pacing only reads correctly on a build attached from the device.
- Make a development build with autoconnect profiler enabled.
- Run it on the device and attach the Profiler.
- Switch to the timeline view and look at one frame's composition.
- Read the share taken by the wait marker first.
// Naming your own regions makes them easy to tell from waits
static readonly ProfilerMarker BallStep = new("IceBreaker.BallStep");

void FixedUpdate()
{
    using (BallStep.Auto())
        StepBalls();
}
What to check when the wait is large
A mismatch between display synchronization and your target frame rate inflates the wait. Target 30 while synchronizing every frame and all the spare time shows up as waiting.
Application.targetFrameRate = 60;
QualitySettings.vSyncCount = 0; // the platform may override this on mobile
Expected result and next step
Once you know the wait's share, the optimization target narrows. If the remaining long frames are still your code, go in function by function. If waiting dominates, look at render load and resolution scaling first.
Official documentation review
Verified
Reviewed the article's code and procedure against official Unity documentation and marked it ready for publication. This is not a claim of an independent Unity project or device reproduction; version- or device-specific reports will be checked in that environment as follow-up.