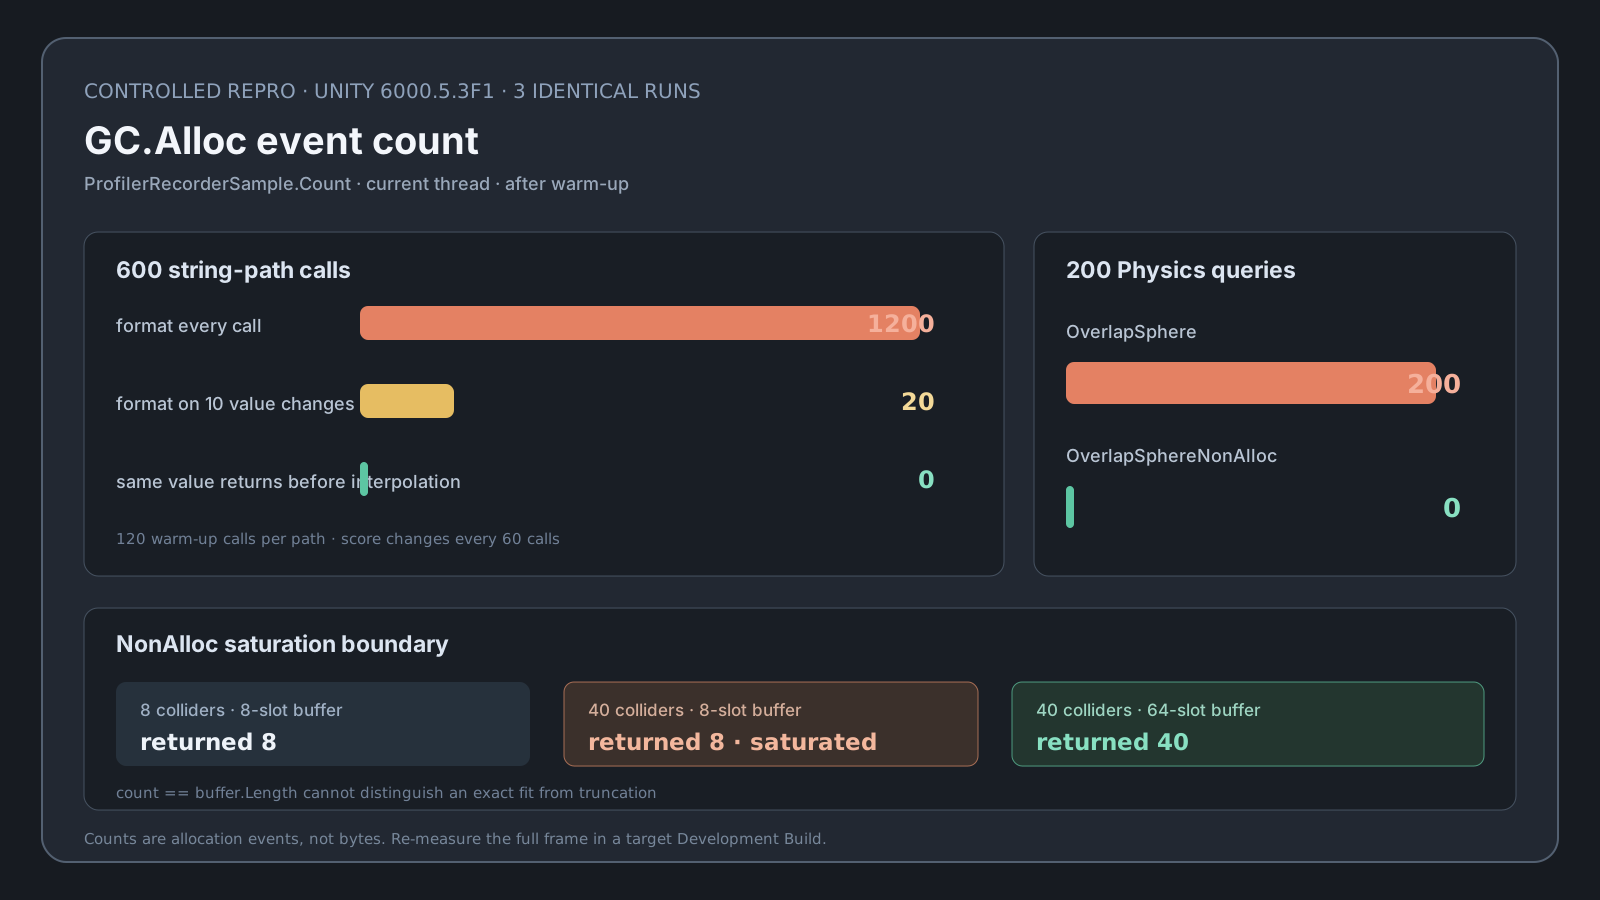
1,200 events, 20 events, then zero across 600 calls
In an empty Unity 6000.5.3f1 project, each string path was warmed 120 times and then called 600 times. A current-thread Internal/GC.Alloc ProfilerRecorder counted 1,200 events when $"Score: {score}" ran on every call, 20 when the score changed every 60 calls, and zero when the same value 42 returned before interpolation. These are GC.Alloc event counts from ProfilerRecorderSample.Count. The recorder UnitType was TimeNanoseconds, so its raw Value was not reported as bytes.
using TMPro;
using UnityEngine;

public sealed class ScoreLabel : MonoBehaviour
{
    [SerializeField] private TMP_Text label;
    private int shownScore = int.MinValue;

    public void SetScore(int value)
    {
        if (value == shownScore)
            return;

        shownScore = value;
        label.text = $"Score: {value}";
    }
}
The returned array allocated 200 times; the reused buffer allocated zero
Forty SphereColliders were placed inside the query radius. Calling Physics.OverlapSphere 200 times produced 200 GC.Alloc events. Calling Physics.OverlapSphereNonAlloc 200 times with one reused 64-slot array produced zero. This is a controlled current-thread Editor measurement, not the total allocation of a real game frame.
using System;
using UnityEngine;

public sealed class NearbyTargets : MonoBehaviour
{
    private const int MaxHits = 256;
    [SerializeField] private float radius = 4f;
    [SerializeField] private LayerMask targetMask;
    private Collider[] hits = new Collider[32];

    public int QueryNearby()
    {
        while (true)
        {
            int count = Physics.OverlapSphereNonAlloc(
                transform.position, radius, hits, targetMask,
                QueryTriggerInteraction.Collide);

            if (count < hits.Length)
                return count;

            if (hits.Length >= MaxHits)
            {
                Debug.LogWarning($"Nearby target buffer reached {hits.Length}; result may be truncated.");
                return count;
            }

            Array.Resize(ref hits, Math.Min(hits.Length * 2, MaxHits));
        }
    }
}
Treat a full buffer as possibly truncated
An eight-slot buffer returned 8 with exactly eight active Colliders and also returned 8 with forty active Colliders. count == hits.Length cannot tell an exact fit from truncation. The example grows the array and retries. Array.Resize allocates only on saturation, so choose the initial size and cap from measured density and log when the fixed cap can still truncate results.
Re-measure in the target build
Use a Development Build with Autoconnect Profiler and repeat the same device, scene, and input sequence. Pin the frame in CPU Usage, inspect the GC Alloc column, and enable Allocation Call Stacks to find the first allocating call. Use Deep Profile only after narrowing the search. The useful target is removing needless repeated allocations, not forcing an arbitrary zero everywhere.
Direct reproduction in a real project
Verified
Test environmentUnity 6000.5.3f1 (c2eb47b3a2a9), Windows 10 22H2 (10.0.19045) 64-bit, 기존 게임과 분리한 빈 프로젝트, Mono Editor, -batchmode -nographics -noUpm
Directly measured the string paths and Physics queries in three separate Unity 6000.5.3f1 Editor processes. All results were identical after removing timestamps.